
Beyond API Monitoring
Nowadays, it is pretty hard to find an application that doesn’t have a data flow that depends on external services, such as databases, queues or caches. We could also include API services in the mix, if it is a third-party service. And all of these are vulnerable to failures, either as software or hardware, something that could lead to serious problems on the system, like an unexpected behavior that would affect the usability, which in turn could drive users away from the service.
Monitoring these services allows us to visualize how the application is behaving with it’s active users. Besides that, monitoring will allow us to get metrics and check the acceptance quality level, which will be useful to shine a light and let us see what is actually happening in the application.
There are some tools that we can use to monitor APIs, such as Datadog, New Relic, Kibana and AWS Cloudwatch. But since we’re talking about monitoring, not about the tools, we’ll be focusing in concepts and how we can use them with almost any tool.
For a good monitoring, we need to worry about some concepts, like reliability, scalability and maintainability.
- Reliability is how the system is able to keep working besides adversities, such as data failures or execution errors.
- Scalability means to maintain a certain performance level with an increase of workloads, that is usually done by increasing the system resource.
- Maintainability refers to a system in which multiple people can make fixes or add new functionalities in a productive way, without adding too much technical debt.
These concepts deserve a deep look, maybe even a dedicated article for each one, but for the sake of this article, we will focus only in their correlation. For example, an API that has a very short exection time, but a very high error frequency it’s not very useful. Another example, is an API that has multiple ways to mitigate errors, but the time to create a new feature is way too long, meaning it doesn’t have a high maintainability, making it difficult to implement improvements and modifications in the business logic, if necessary.
With high traffic in the API, some indicators are easier to spot, such as usability and scalability, which can be seen through the respose time. Because of the high demand, the API will be processing more, and thus the response time will increase. Also, the usability is affected because of the slow response from the service, giving the user some headaches and making his application slower. It is important to notice the difference between response time and latency. Latency is the time from sending the request and receiving it back, with this time being affected by connection issues, and response time is just the time that the API takes to process the response. In this way, we will be focusing in response time because the connection issues are out of our control.
How to improve?
In order to achieve improvement, we need to answer some questions. Using an example of traffic increase, we can ask: how much of resource we need to increase to maintain the performance? How the performance is affected if the resources are the same, but the traffic is higher? To get those answers, we need numbers, and thus, monitoring.
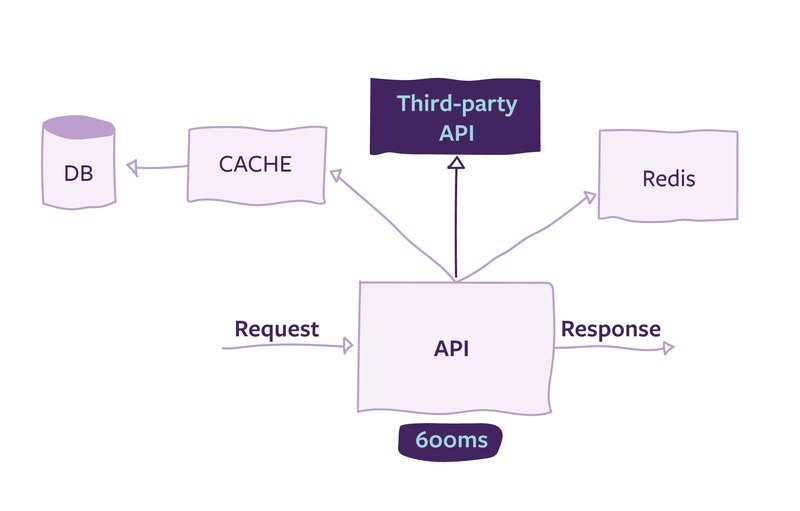
Monitoring is sometimes a complex task, because it involves a dependence on other services, like database, external API or cache, as described in the picture below. These services affect the response time because a request is only completed when all the responses from the dependencies are completed. Besides that, each time we send a request, the response time is a bit different, and because of this, response time metrics must be a set of values collected through the time, and not just a number.
Once we have these response time values, usually the first thing we think is to get the average value of the request. However, even though it is a number that helps to understand the system’s behavior, it hides the users in the extremes, in other words, the users with a response time that is either too low or too high.
The reason we need to find these users is to focus the API improvements to them. And for this, we can use percentiles to try to solve the problem. If we order the response time ascending, the value right in the middle is called median. The median is also known as the 50th percentile, or p50, and indicates what is the response that the users usually have. In order to know the behavior of the users that have a longer response time, we need to filter by response time higher than 95% or 99% of the set.
High response time can be affected by either the client or the application. The client could have sent a non-optimized request, and the web application has users with multiple entries in the database, such as favorite books. Users that use the application more often usually have more entries in the database, make more transactions and have more favorite items. For this reason, requests done by this users will take longer than requests done by regular users, and thus, be found in higher percentiles.
Still in the context of this book web application, if we wanted to make an optimization, the users in the higher percentiles are great candidates to be focused on, because the improvements done for them will be spread to the other percentiles. But we need to be careful to avoid choosing too specific percentiles, like 99.99%, because they’ll have a high maintenance cost and might belong to cases that don’t occur with frequency. Remembering that, depending on the business strategy of the application, maybe it is not important to use the response time to find optimization points.
How to go beyond response time monitoring?
Because APIs usually are a composition of multiple services, it would be ideal to monitor those services as well, since they will directely affect the response of our API. In order to do this, a periodic verification of those services is essencial. Be careful to not just check if the response is 200, but to validate the response content. The content is important because we don’t have control of the modifications by third parties, and that’s why we need to define a “contract” of response in idempotent methods (which the response is always the same independently of how many requests have been sent).
Besides that, again in the context of our example API, we could create an activity tracking, with which, for each request, we could monitor if the API is behaving as expected and not going through unwanted flows. If we are going to use this tracking, we also need to anonymize the data, to avoid bigger problems in case of leaks and protect our users data.
But how to maintain these improvements?
Since we are constatly creating new functionalities or making code refactoring, we are not sure how the performance will be affected. Even though we have tests to validate the functionality, the performance contract is not explicit. Because of this, we use SLA (Service Level Agreements), which could specify the response time for each percentile. For example, in p50 we could only have a response time of at least 200ms, while in p90, it is set to 900ms. Keep in mind that when this test is done, the requests must be sent in a environment as close as possible from production, with high concurrency and requests that will bring heavy responses.
We talked about a lot of theorical stuff and very specifically about response time, but how all of this affects the business? There is a direct relation between performance improvement and bringing more clients/users to the application? The answer is, not surprisingly, maybe. Performance improvement is not everything that will affect the sucess of the application, usability and interest are also great indicators.
When we improve the application’s performance, for example, in an e-commerce application when we decrease the time to make a purchase or the navigation becomes more fluid, the final user will be more pleased, and it could lead to more purchases. We know how a slow application can be frustating and we just stop using it after a couple of minutes, or even seconds. Also it really creates a bad impression of the service.
References
- Tyler Treat (2015), Everything You Know About Latency Is Wrong
- Kleppmann, M. (2017). Designing Data-Intensive Applications. Beijing: O'Reilly. ISBN: 978-1-4493-7332-0
- Patrick Poulin (2020), API Monitoring: A False Sense of Security
