Card sorting for a purpose-driven navigation
It was only the beginning of our rebrand process, and we were eager to apply it to our website. There was some content already, we had been building other topics and our design had a sitemap that looked rock solid. But, soon enough, we started asking questions like: “shouldn't this content be tied to that one?”, “what was supposed to be covered here again?”, etc.

These questions made us realize that our solution had lost sense outside the project’s context. We tried several adjustments, but they never seemed to have enough foundation, until we finally decided to apply a method that could provide us with consistent documentation able to solve our problem and answer our future doubts: the card sorting.
In this post, I will cover how to structure, apply the card sorting, but mostly I’ll focus on how to analyse it’s findings, paired with insights from our experience when performing it.
The method
The card sorting is used to group topics in a way that is logical both to the project and the end-user. The book Universal Methods of Design (by Bella Martin and Bruce Hanington) classified the method as attitudinal, qualitative, quantitative, observational, and self-reported.
The dynamic is easy and fun but it has a complex analysis. It aids to understand the way people structure information and to answer questions like:
- How should my menu’s groups be named?
- How do people want to see information groups?
- Where, in my product, are people looking for a specific information or feature?
- How many categories should I add to my product’s menu?
The technique can be applied in 3 formats, and the choice will depend on project status and the goals it's aiming at. It doesn’t matter which one you choose they all work using cards for topics and categories to be sorted by persona representatives or even real end-users. The peculiarities of each format will be highlighted whenever needed in the following sections.
Formats
1. Open
Participants must sort topics and then name the groups created.
Used to build and is generally applied to starting projects. It enables us to understand how a participant's mental model works when naming things and sorting topics.
2. Closed
Participants must sort topics into predetermined categories.
Used to validate and is generally applied to ongoing projects. It enables us to understand how participants fit topics to predetermined categories.
3. Hybrid
Participants can sort topics to predetermined categories or create their own.
Used to validate and as a “change argument” in projects. It enables us to validate if predetermined categories fit the participant's thinking and to have inputs on how to label these categories.
For us, as it was the beginning of a project, even with a sitemap created we chose to use the open format so we could also collect insights on the proposed content.
Setting up
The method can be applied both in person and remotely, provided the help of specific tools. In this article I will only address my experience in the first case.
Participants
You must recruit at least 15 participants and group them individually, in pairs or trios. Anyhow, take into account that these people must be representative of end-users of your product or, even better, end-users themselves, always including different ethnic and social aspects.
Sometimes it may be more interesting to group them by persona but in our scenario the diverse discussion was as important as the sorting. Then, we ended up with 5 groups made of at least two distinct profiles.
Place and supplies
- Pick a distraction-free room able to comfortably accommodate the group with a big table or board to lay out the cards
- Cards of a specific color/type for topics
- Cards of a specific color/type distinct from topic cards for categories
- If you’re using a hybrid or open format, also provide empty cards and pens/sharpies in order to category labels to be made
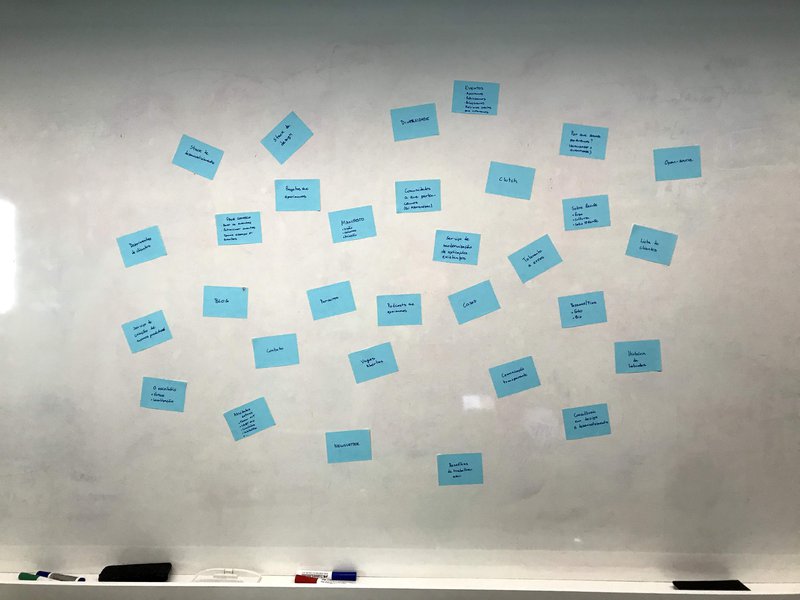
Tips: 1. Use cards of different colors/types between sessions to make analysis easier and have different ones to use when the group cannot achieve consensus. 2. we used magnetic notes, which stick to any surface paper and are really easy to drag around (tesla amazing) 😍

Content selection
List up all content topics from individual pages, features or small groups in a section and write them on a card. Only use the ones you will have on your product and remember that all of them must be an accurate sample of what you are analysing. If needed, you can also add a brief description and/or a picture on the back of the card.
If you’re using a closed or hybrid format, also list all existing categories in a distinct card from the topic ones.
Applying the method
I have my own way when applying this kind of dynamics. I try to give the environment a casual feeling in order to enable people to be comfortable and relaxed, which usually includes bolo de rolo (our beloved regional cake) and music, sometime aromatherapy. This makes any dynamic hard to resist so everyone eventually engages. If you’re not up for it, a simple room with a big table or board with some chit-chat before starting may accomplish that same feeling.
Moreover, as current practice in design workshops, I always have an observer pair to help me going through the following phases:
- Provide the material and explain the activity goal. Also, request formal consent for the documenting method you choose (pictures, recordings, etc).
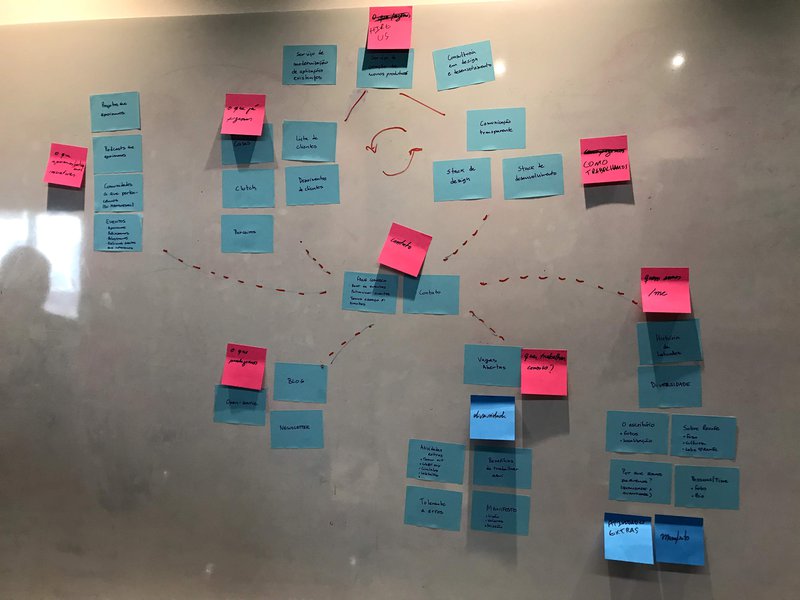
- Ask participants to sort the cards in a way that makes sense to them and to do their best to achieve consensus for all groups in 30 minutes. When using open or hybrid, remember to ask them to label the groups within that time
At this point, avoid interferences but always encourage them to talk and explain to each other or to you why they are grouping the cards together or using a specific label to a group.
You can set a max number of topic per category or how many categories must be created depending on your goal. In our scenario, we haven't set any limit.
- Take notes and document the groups made and deliberate about it, with or without participants
- Set up for the next session randomly spreading the cards
Listening to participants during sorting will demonstrate how they think, instead of just what they do. Take notes regarding comments, body language, and decisions during the whole session, don't leave it to the end.
Time
45 minutes session:
- 5 to prepare
- 30 sorting
If open or hybrid, leave the last 10 minutes to label groups
- 10 for discussion/analysis from mediators and to set up the next session
This approach was based in many articles and blogposts and reflects the context of the project I was working on. It was adapted from the one proposed by Nielsen and has proven effective to our goal.
Findings
To aid the analysis, I came up with a matrix in which I've graded how many times a topic was placed together with another. Even though it highlighted obvious groups, on its own it wasn't able to define the best architecture, so stay tuned to the next steps.
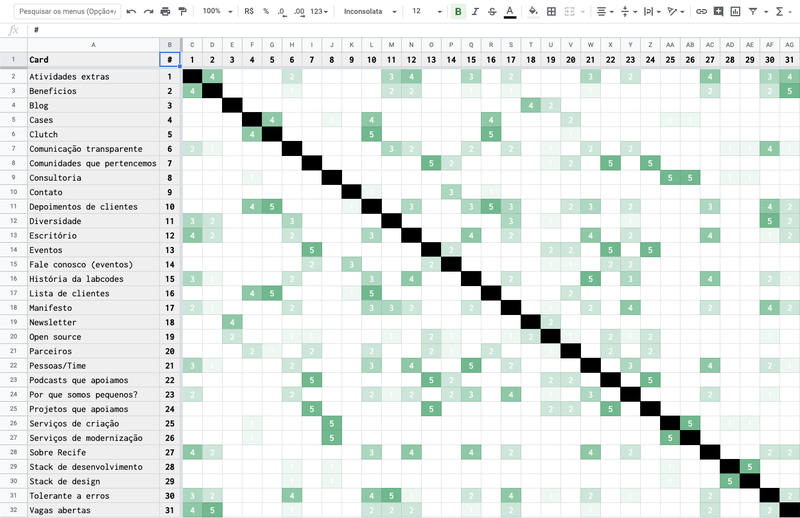
I have made a template spreadsheet that you can use on your projects <3
The following method is for an open card sorting. Therefore, if you're using a closed one ignore all steps that relate to label categories.
Quantitative
- List all topics that were placed together by all participants and identify the labels attributed to its groupings (100% consensus)
Resulted in 7 groupings as 4 pais, 2 trios, 1 quartet, and 13 of 31 topics were left alone.
- List the topics without significant consensus (<80% consensus)
I've chosen 80% due to the participant groupings and by observing results variance, which left us with 4 topics ungrouped.
- List topics that were placed together by at least 80% of participants and identify the labels attributed to its groupings (80% consensus)
Resulted on changes on previous groupings and added 2 pairs.
It's also possible to use a dendrogram for open and hybrid card sortings to refine this step, a diagram that shows the hierarchical relationship between objects used for tools dedicated to this analysis. I haven't reproduced it, though.
Qualitative
The following method was based on insights collected during sessions and its goal is to find connections between the diverse thinking models observed.
- Group up labels that are semantically similar and identify anomalies (the one different from the others or from its topics), then verify if the content converges with the groups created
At this phase we were able to merge 4 small groups into one with 7 topics that converge in their meaning
- List other relationships (e.g. topics grouped to the same cards but not together)
Resulted in 2 new groups
Results
There's no magic recipe for the results
Quantitative data is capable of defining if topics should be grouped together or apart, whereas topics without significant numeric data should be fitted after a thorough analysis of qualitative findings, which will vary from group to group but can also be aided with engagement validation afterwards.
Since most of the results are of a subjective matter, the card sorting alone won't be able to tell you exactly which label is best for a category or what should be on it. Instead, it will provide us with several insights on which path to follow. Even though the method doesn't deliver a complete answer, it brings users closer to (or inside) the project, making it easier to understand the mental reasoning of each persona and using it in the process’ core in a friendly, even playful way.
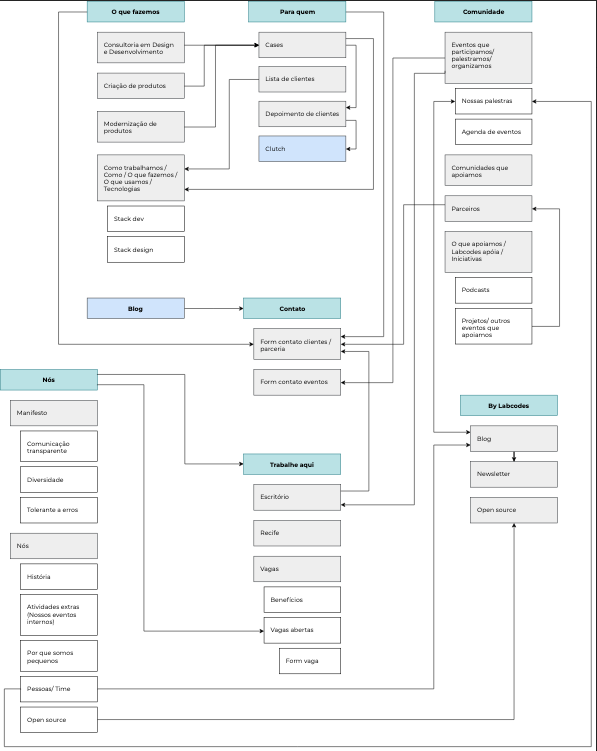
Thereby, we can also use qualitative findings beyond its original goal, turning the product more useful and efficient. For us, the result was a sitemap in which most of the connections between pages came from comments in card sort sessions, even for cards that weren't grouped together.
Way further from the results for the product, because <del>of the cake</del> it was applied to an internal project and for its light and fun aspect, the card sorting also brought engagement from other teams. Therefore, if you have difficulties spreading the word of the design culture in your organization, this could be the entrance to research dynamics, due to its low cost and time efforts with tangible deliverables ;).