Graph Databases: Talking about your Data Relationships with Python
Have you ever considered how many relationships you have in your virtual life? Every friend or page liked on Facebook, each connection in LinkedIn or Twitter account followed is a new relationship not only between two people, but also between their data. In Brazil only, we have 160 millions Facebook users. How can we represent and manipulate all these relationships?
Suppose we have a data schema similar to Facebook, where a user can be friends with other user or can like a page. Let’s try to structure these data in tables, as is done in Relational Databases.

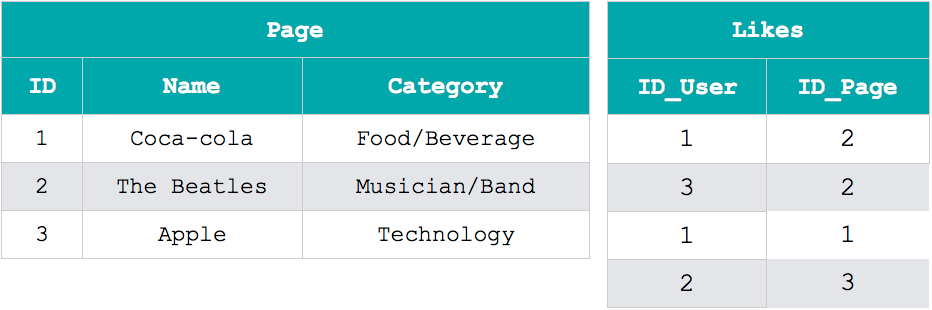
In order to store the relationships between users and between users and pages, it is necessary to create 2 tables that connects the identifiers for users and pages. For untrained developers that are not used to work with tables, finding out what are the pages that the user John likes is not a trivial task.
This trouble to visualise the relationship between entities in a Relational Database is a great reason to introduce the concept of graph. Graph is a data structure formed by a set of vertices V and a set of edges E. It can be represented graphically (where the vertices are shown as circles and edges are shown as lines) or mathematically in the form G = (V, E). This is a simple, intuitive and graphical way to illustrate the relationship between objects. Given the concept of a graph, we can represent the same scenario presented previously in a different structure, as shown in the image below.
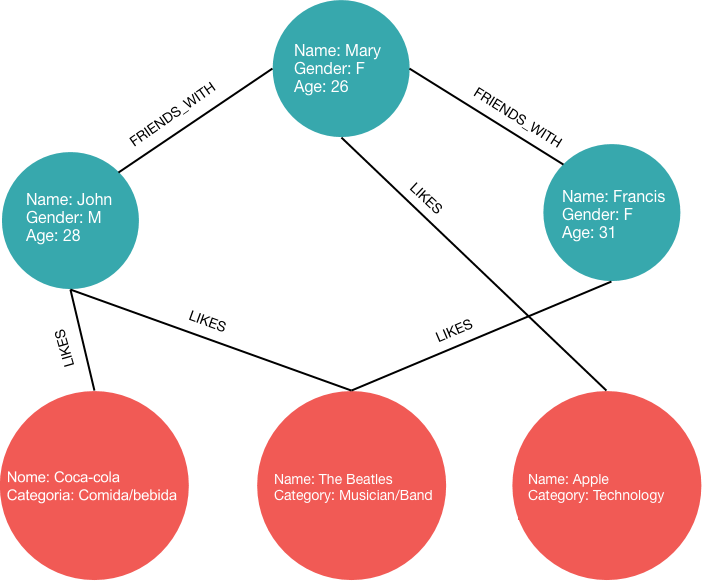
With this graphical representation, Figure out who is friends with who and which pages certain user likes is more intuitive. In a similar way, it is possible to store data and their relationships using a Graph Database.
Graph Database
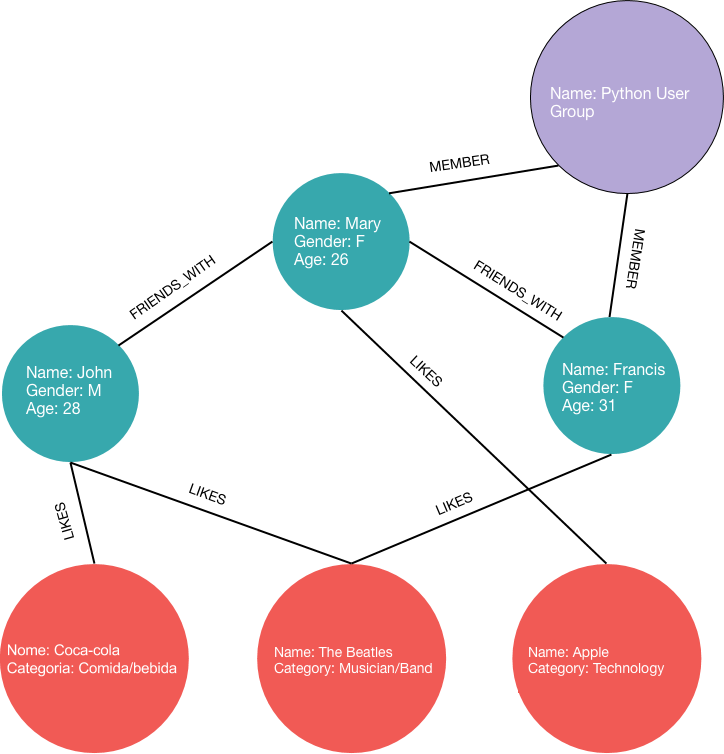
Graph Database is a system that stores data in a graph structure and allows the execution of more semantic queries, directly retrieving related data. This type of database not only improves the representation of relationships, but also lets us use more elaborated data analysis techniques, such as community detection, pattern recognition and centrality measures. Another advantage of Graph Databases is the flexibility in the data schema. While Relational Databases requires new tables or alterations in the existing ones to add new types of data, in a Graph Database we can add new type of vertices and edges without alterations in the previously stored data. For instance, the image below shows how the graph would look like if we add the concept of “Discussion Groups” to our social network app.
The most modern Graph Databases also offer advantages in performance, since they use NoSQL based storage mechanisms. In this way, these databases became scalable and can be distributed to several processing cores in the cloud. The most popular Graph Databases with this kind of approach are Neo4J, OrientDB and TitanDB.
Neo4J
Neo4J is the first and most popular native Graph Database according to DB Engines website. It is an open source project implemented in Java and it has its own query language called Cypher. The community is quite active in Github and Stackoverflow, in addition to available blog posts and ebooks. The access to Neo4J database can be done using the Java API or using the RESTful API.
REST API Example
The access to the REST API can be done through Neo4J browser, submitting Cypher queries. Some examples showing how to create a new vertex (node), create a new relationship and submitting a query are listed in the following sessions.
Creating a Vertex (Node)
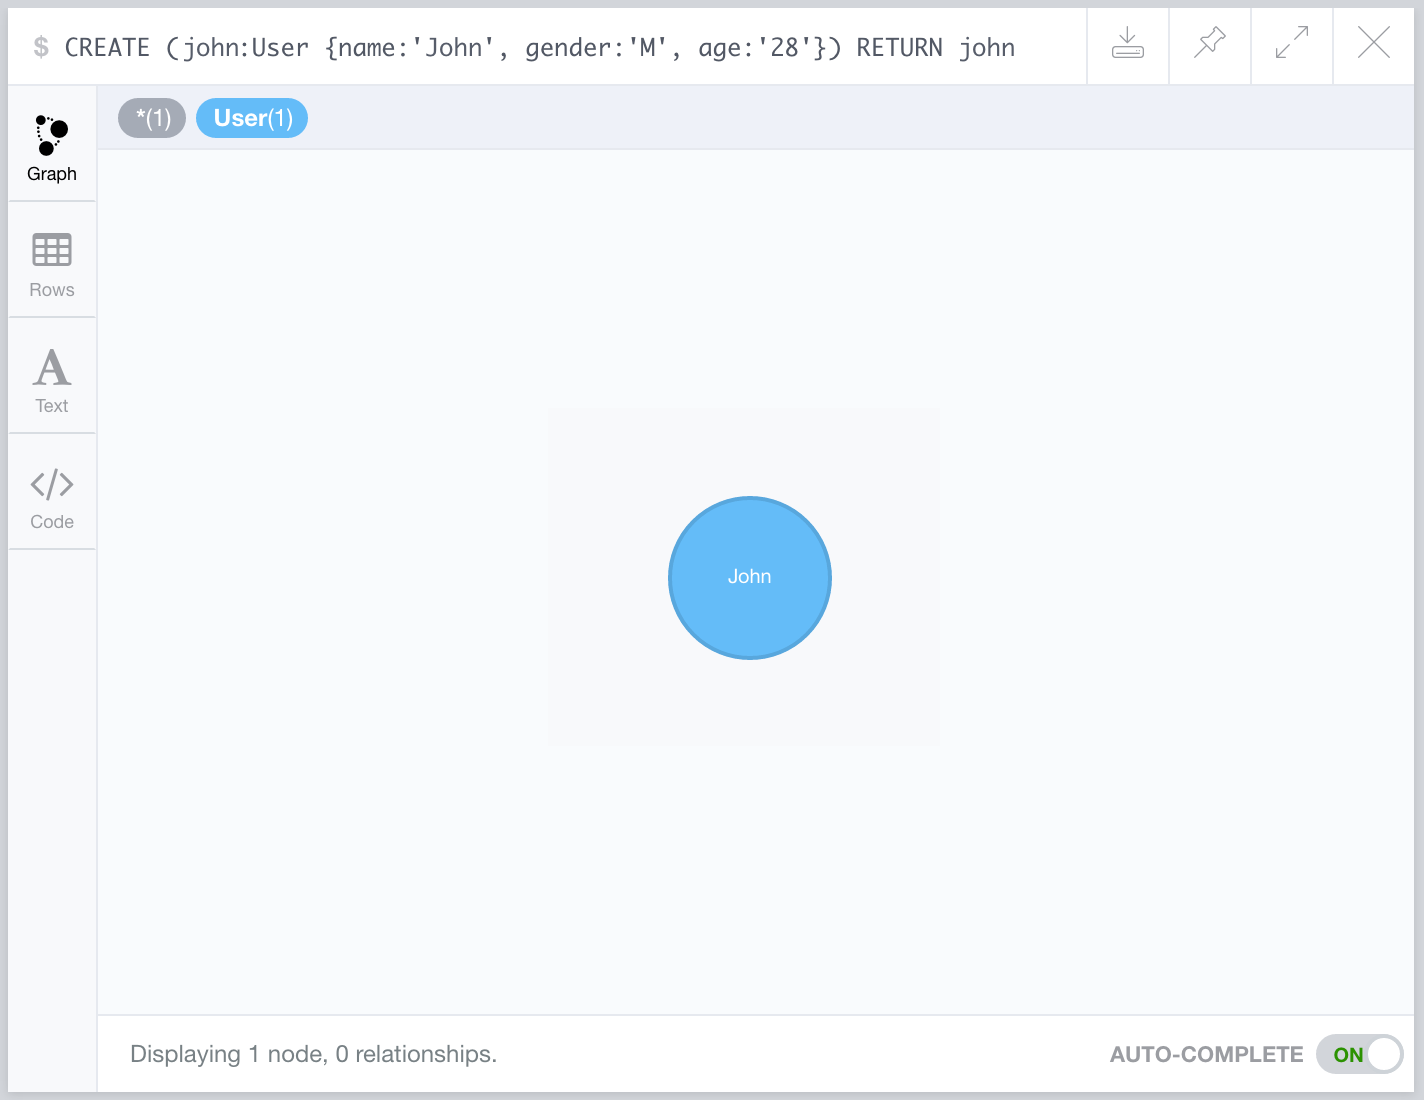
The following Cypher query creates a new node in the database. The name that comes before colon : (john in this example) is the node alias and it is only used as a reference in the query and it is not stored in the DB. The name User indicates the label (or type) of the node being created. The nodes attributes are passed inside the braces {.
Once the Cypher query is submitted to Neo4J browser, the result can be seen in a graphical way or in the form of a JSON object returned by the API. Since the query only asks for the return of the created vertex, only one node is shown.
The JSON object returned by the REST API shows, among other data, a graph object that contains the list of nodes and edges. Each node has an id, a list of labels and a set of properties. Since this is the first node created, the list of nodes only has one item.
Creating a Relationship
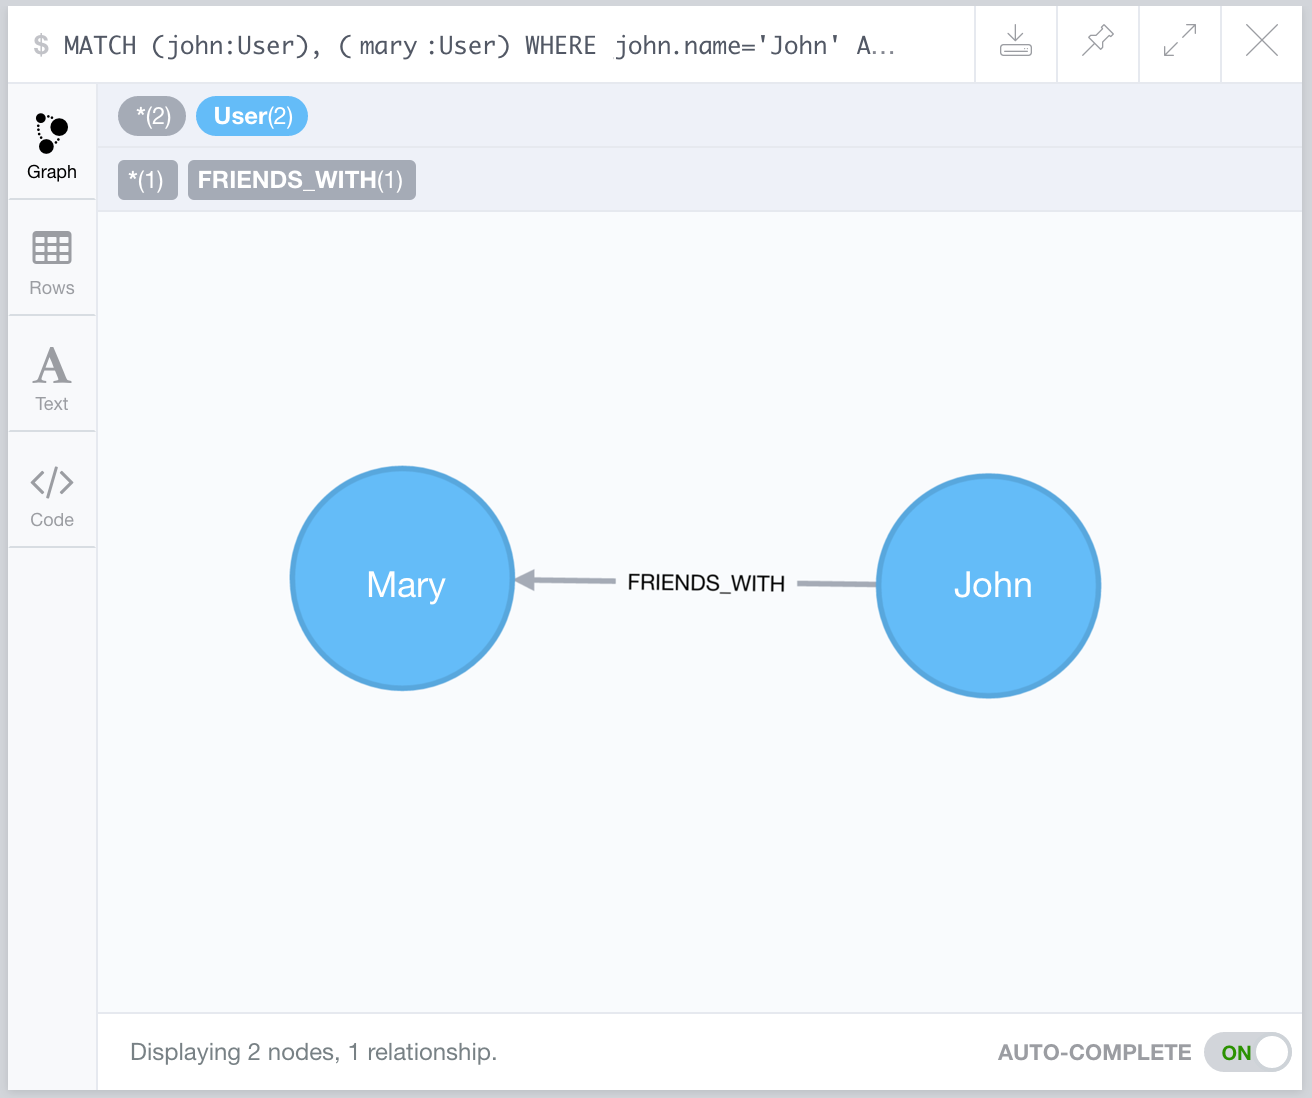
Assume that two nodes were created and stored in the database. The following Cypher query creates a relationship between two existing users. The relationships also have a label (or type) and can be referenced using an alias. The arrow notation -[REL]-> is used both for creating and for querying relationships. The tip of the arrow indicates the relationship direction, but if the relationship is bidirectional the notation used is -[REL]- (without the tip).
Note that before creating the relationship, it is necessary to retrieve the nodes that will be connected. In this example, the nodes for the users John and Mary were retrieved by their names and then they were connected through the FRIENDS_WITH relationship with the alias f. The return given by this query shows the users retrieved and the new relationship created between them.
The graph object in the API’s JSON response now shows one item in the list of relationships. The relationship has an ID, its type, its start node, its end node and possibly a set of properties. For instance, it would be possible to store the date of when the relationship was created (date when John became friends with Mary).
Querying the Graph
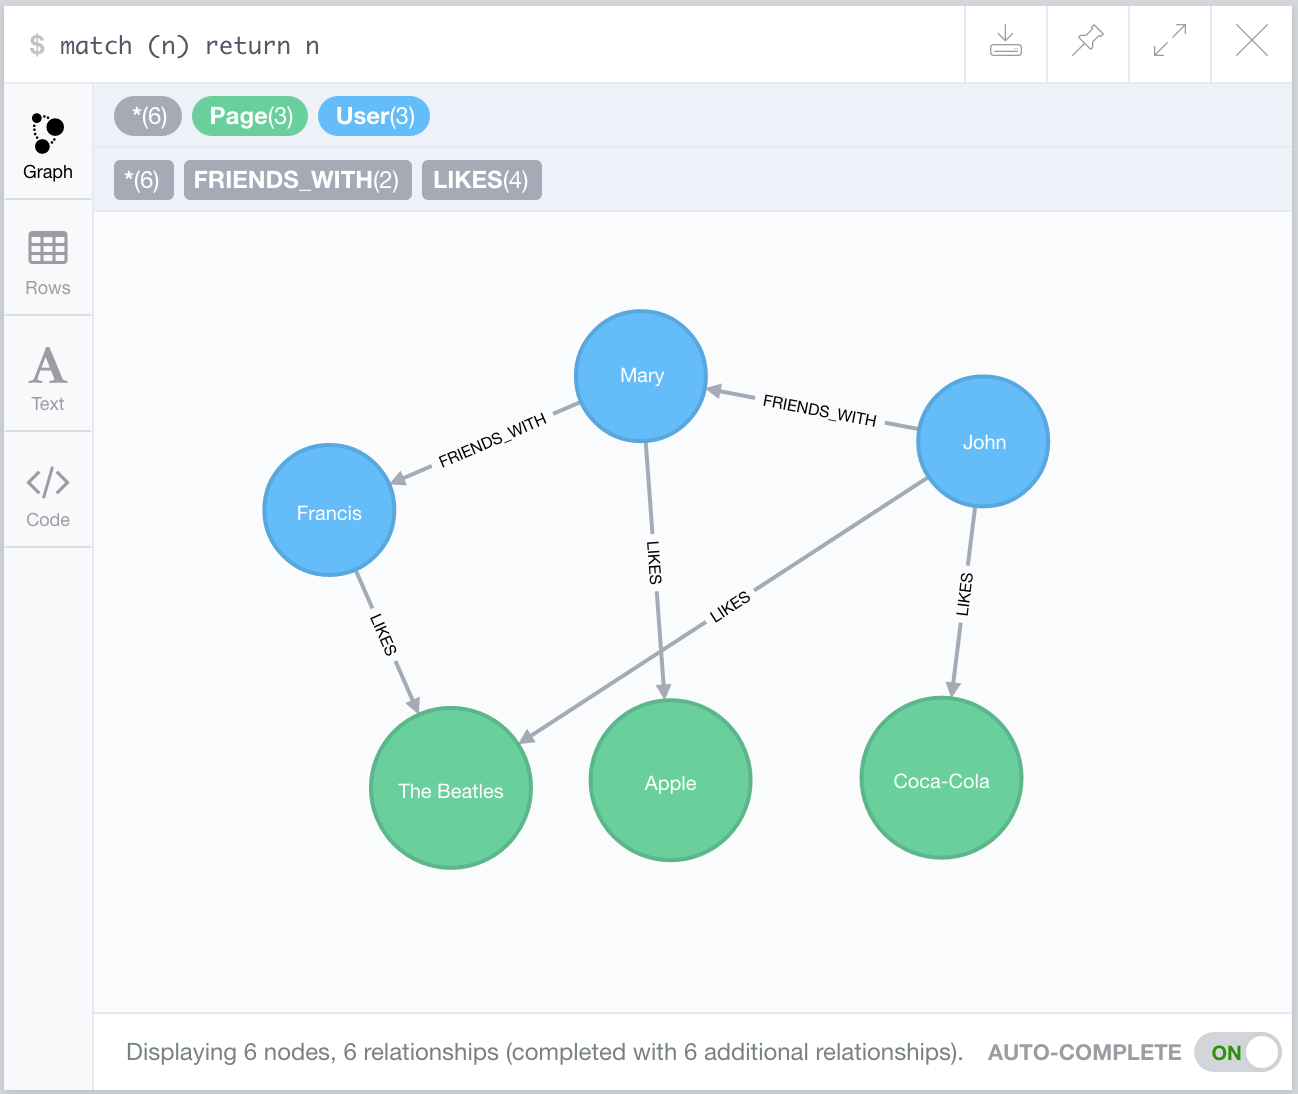
Now that it is known how to create nodes and relationships, we can store the database presented at the beginning of this post in Neo4J.
The following query can be used to retrieve the pages that the user John likes. This query will return a subgraph of the original graph, showing the pages’ nodes that are related to John’s node through a LIKES relationship.
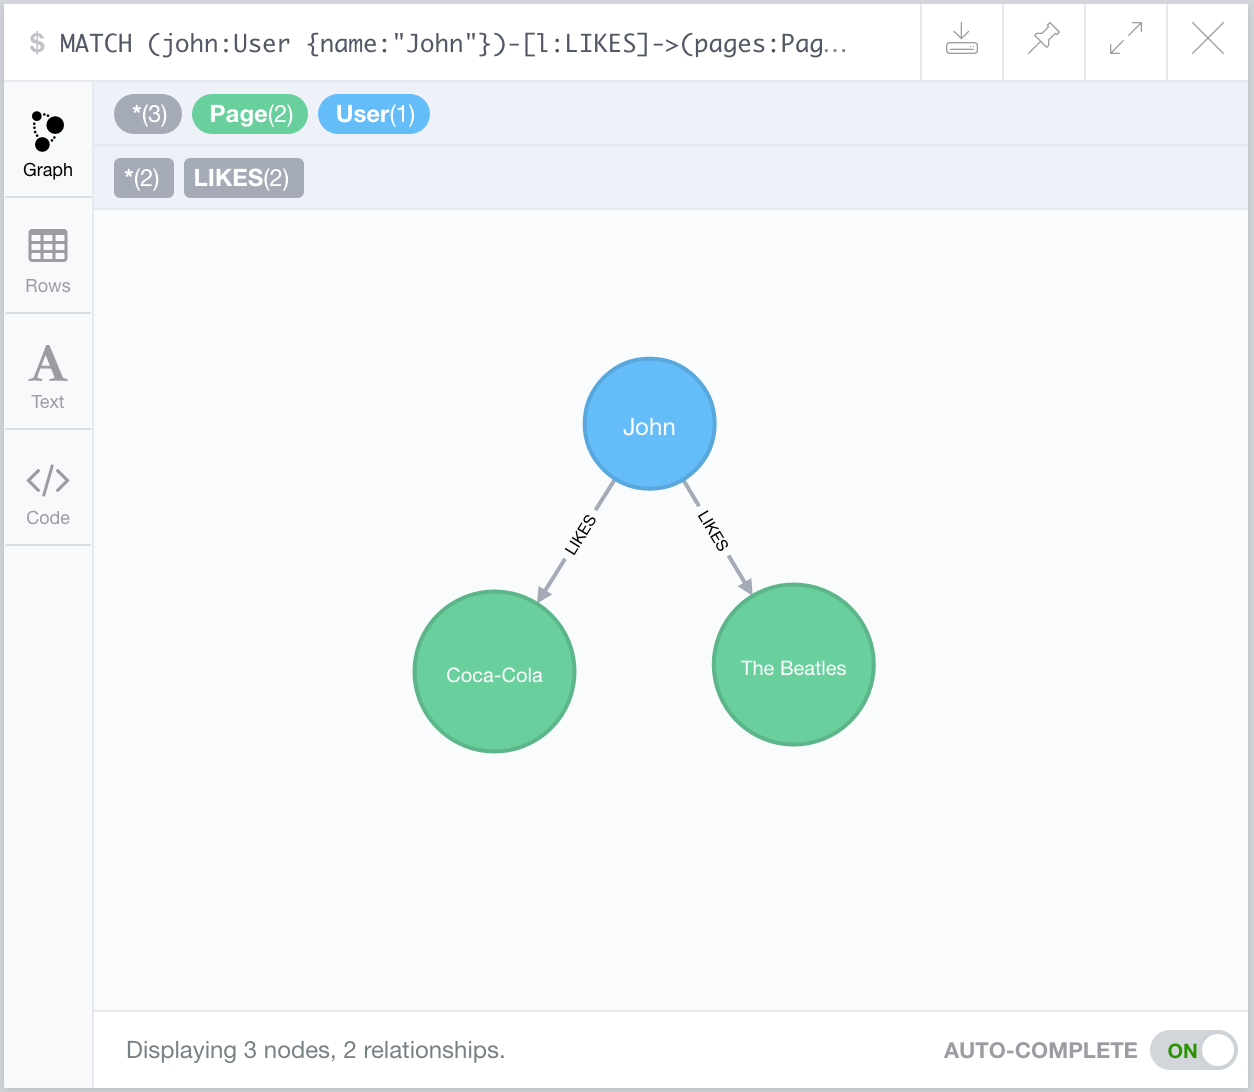
When this query is submitted, the REST API returns a data object that contains all the rows that match the query. In this example, two rows and three columns are returned: the user John properties, the LIKES relationships properties and the properties of the pages that John likes.
Python Example
In addition to accessing the database using the REST API and the Java API, it is also possible to integrate Neo4J with a Python application using Py2Neo module. This module supports Python 2 and 3 and it allows the submission of Cypher queries to the database.
Creating Nodes and Relationships
The Graph class from Py2Neo is used to access the database given the password as a parameter. From an object from Graph class, we can begin a new transaction and create nodes and relationships, recording these actions in the database at once.
In the above example, the nodes representing users John and Mary are created initially and then, the relationship representing John and Mary’s friendship is created. Finally, the transaction is committed in order to record these alterations to Neo4J.
Querying the Graph
Py2Neo allows the execution of Cypher queries using the run function from the Graph object. In addition, the module also provides some methods that makes the submission of queries easier. The following example shows how the query to retrieve the pages John likes would look like using Py2Neo.
First, it is necessary to get John’s node using a NodeSelector object and call select function, passing the node’s type and which properties values it should match. This function returns a list of nodes that matches the conditions passed as parameters. Then, the match function is used to retrieve all relationships starting at John’s node and that have label LIKES. This function returns the list of relationships, so it is possible to print the end nodes of each relationship, as shown in the image below.
>>>
  (e0f611c:Page {category:"Músico/Banda",name:"The Beatles"})
  (ac6964f:Page {category:"Comida/Bebida",name:"Coca-Cola"})
Comparing Graph DBs
Besides Neo4J, there are other popular graph databases according to DB Engine site.
OrientDB is a NoSQL Multi-Model database, which means it stores data in the form of documents, key-value stores, objects, graph and others. Like Neo4J, OrientDB is also implemented in Java, but it uses an extended version of SQL that includes special operators to manipulate graph. This database allows the creation of a pre-defined data schema and the definition of complex data type, like dates, decimals and binary objects (BLOB).
TitanDB is a native graph database implemented in Java. In order to establish connection with the hard disk, Titan needs to be linked to a data storage system — Cassandra, HBase or BerkeleyDB — that is suitable for the application. The creation of nodes, edges and the submission of queries can be done through a Java API or through a Gremlin server.
Comparing Queries
For this experiment, the same query (what pages John likes) was written in Cypher (Neo4J), extended SQL (OrientDB) and Gremlin (TitanDB)
Comparing Performance
One of the basic tasks when manipulating a database is to retrieve an object given its id. The following experiment records the average time to retrieve a node by its id, given an 500000 nodes graph and 4 clients executing this action 200 times. This process was executed using Neo4J, OrientDB and TitanDB using Cassandra as backend.
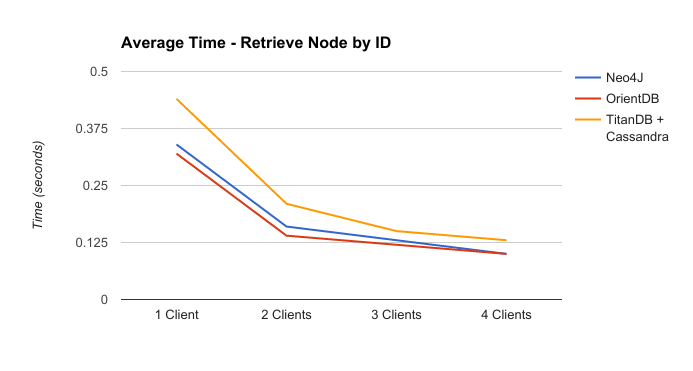
According to the chart above, Neo4J and OrientDB have similar performance, being OrientDB slightly faster to retrieve a node given its id. On the other hand, TitanDB using Cassandra as backend has a bad performance compared with the other DBs. However, TitanDB can be connected with other backend services, which can improve its performance for this task.
Another common concern among developers is the amount of memory taken by the database. In this experiment, a graph containing 32,000 nodes and 256,000 edges was stored in Neo4J, OrientDB and TitanDB and the amount of memory required by each database was measured.
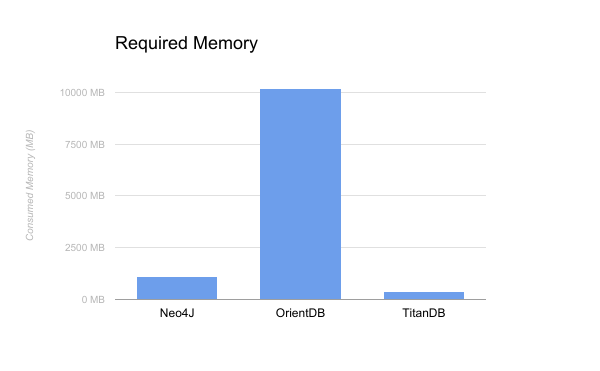
From the chart above, we can notice that OrientDB is the one that consumes the most, reaching up to 10.156 MB of memory. On the other hand, TitanDB requires less memory, only needing 388 MB to store the graph.
Comparing Neo4J with Relational Databases
It is possible to notice the main difference between relational and graph databases regarding information retrieval, when we compare how the same query is written for each system. Consider a query that returns all users that like a page “The Beatles”.
We can see that the SQL query is more long-winded than the one written in Cypher. In relational databases, it is necessary perform join operations between tables in order to find related data. On the other hand, in graph databases, the relationship between objects is explicit in the query, allowing information retrieval in a more direct way.
Comparing Performance
Relational and graph DBs are suitable for different purposes depending on the application. If the application requires the representation and access to relationship between data, graph database is the way to go. However, if the application is only interested in the information stored inside an entity, relational database can perform better in this situation. An experiment was made with the objective to verify how long does it take to Neo4J and MySQL (RDBMS) to execute two types of query:
- Structural Query: perform a 4 level width search
- Data Query: count number of nodes/instances that has a certain attribute with value below a given threshold.
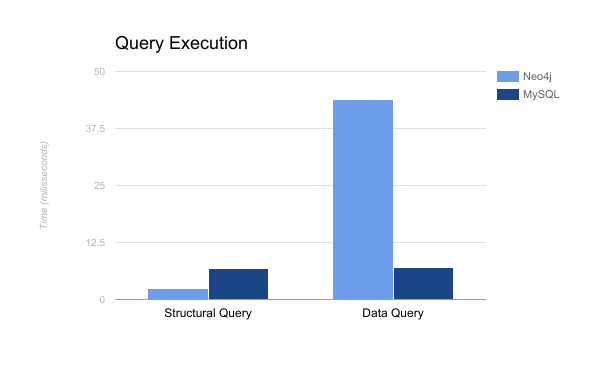
According to the numbers obtained from the experiment, it is possible to notice that MySQL took more time to respond to a structural query in comparison to Neo4J. On the other hand, Neo4J took more time to respond to a data query.
Applications
There are several areas where the use of graph database is relevant due to the nature of the data. One of these areas is Social Network, such as the running example of this post. Other important area is Bioinformatics and Genetic Analysis, where the interactions between particles and molecules are better represented as a graph. Telecommunications also uses graph databases to store information about connections between devices and to analyse areas in the network that may need a reinforcement in the infrastructure.
Besides these traditional areas, one interesting application using graph database was developed by William Lyon: he used a graph to represent interactions between the characters of the book “A Storm of Swords”, the third book from “A Song of Ice and Fire” novel series. The mathematicians Andrew Beveridge and Jie Shan gathered all interactions between the book’s character in a CSV file with three columns: start character, end character and the weight of the relationship between them. Once Lyon loaded this data to Neo4J, he was able to do some interesting analysis about clusters and the most important characters of the plot, generating the following visualisation.
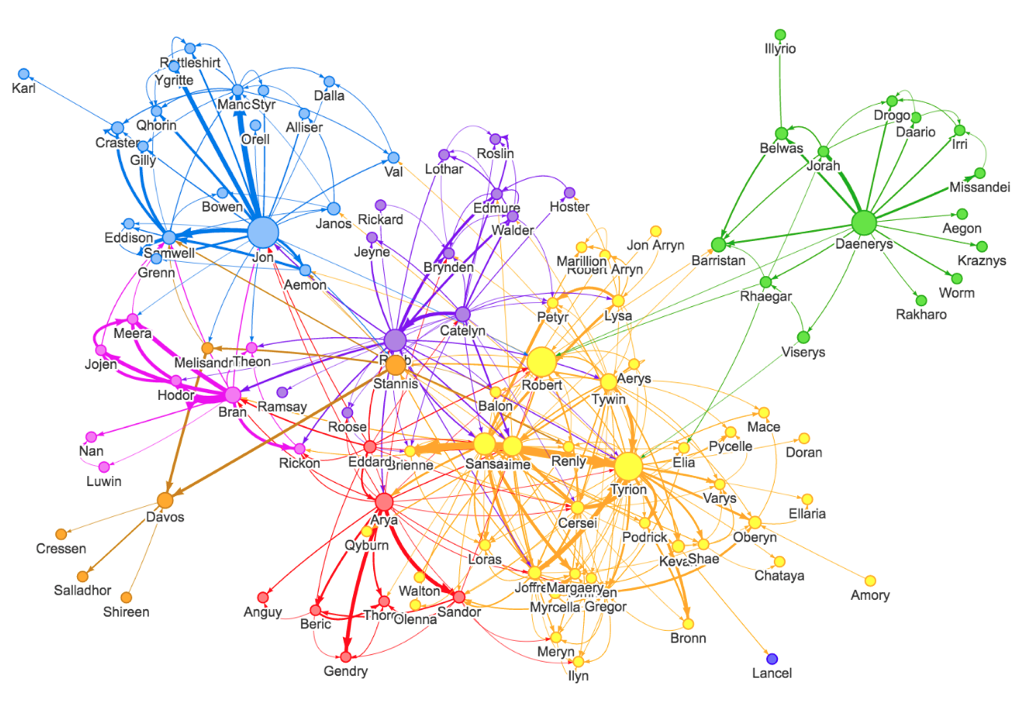
The node’s size is proportional to node’s betweenness centrality, which means the amount of shortest paths between two other nodes that goes through the node. This measure indicates which characters passes information between clusters. To calculate the node’s betweenness centrality, Lyon used Apoc library that contains several procedures written in Java that can be called from a Cypher query. The following code snippet show how to calculate betweenness centrality to all characters in the database.
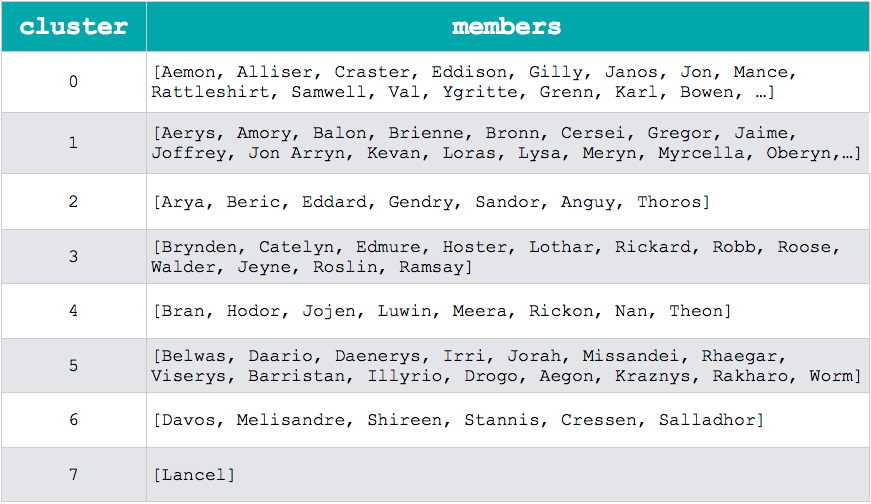
The different colors in the graph indicates different characters clusters in the plot. In order to identify these clusters, Lyon used iGraph module in Python, that allows the manipulation of the graph and implements community detection algorithm. The following code snippet shows how iGraph can be used to identify characters clusters.
At first, nodes and edges stored in Neo4J are loaded to iGraph virtual graph. Then, the clusters are detected by the community_walktrap method and each node gets a new attribute indicating which cluster that node belongs to. Finally, this new information is stored again in Neo4J. The table below show the cluster detection method output.
Lyon’s work is a fine example of how different kinds of analysis can be done in a graph database. From these analysis, we can extract new knowledge about the main characters and how they interact with others. In the original article, Lyon also shows other measures and algorithms related to graph analysis.
Data analysis and knowledge extraction are concepts that refer to graph structures and storing data in DBs that facilitate the execution of such activities can offer great help to the application. To learn more about graph DBs, here are some interesting links:
